Alaska, Utah and three other states are warming fastest, MIT study finds
A new state-by-state dataset built from NASA and European satellite-reanalysis records shows Alaska warming more than three times as fast as Hawaii since 1980, giving planners a tool to target where adaptation spending is needed most.
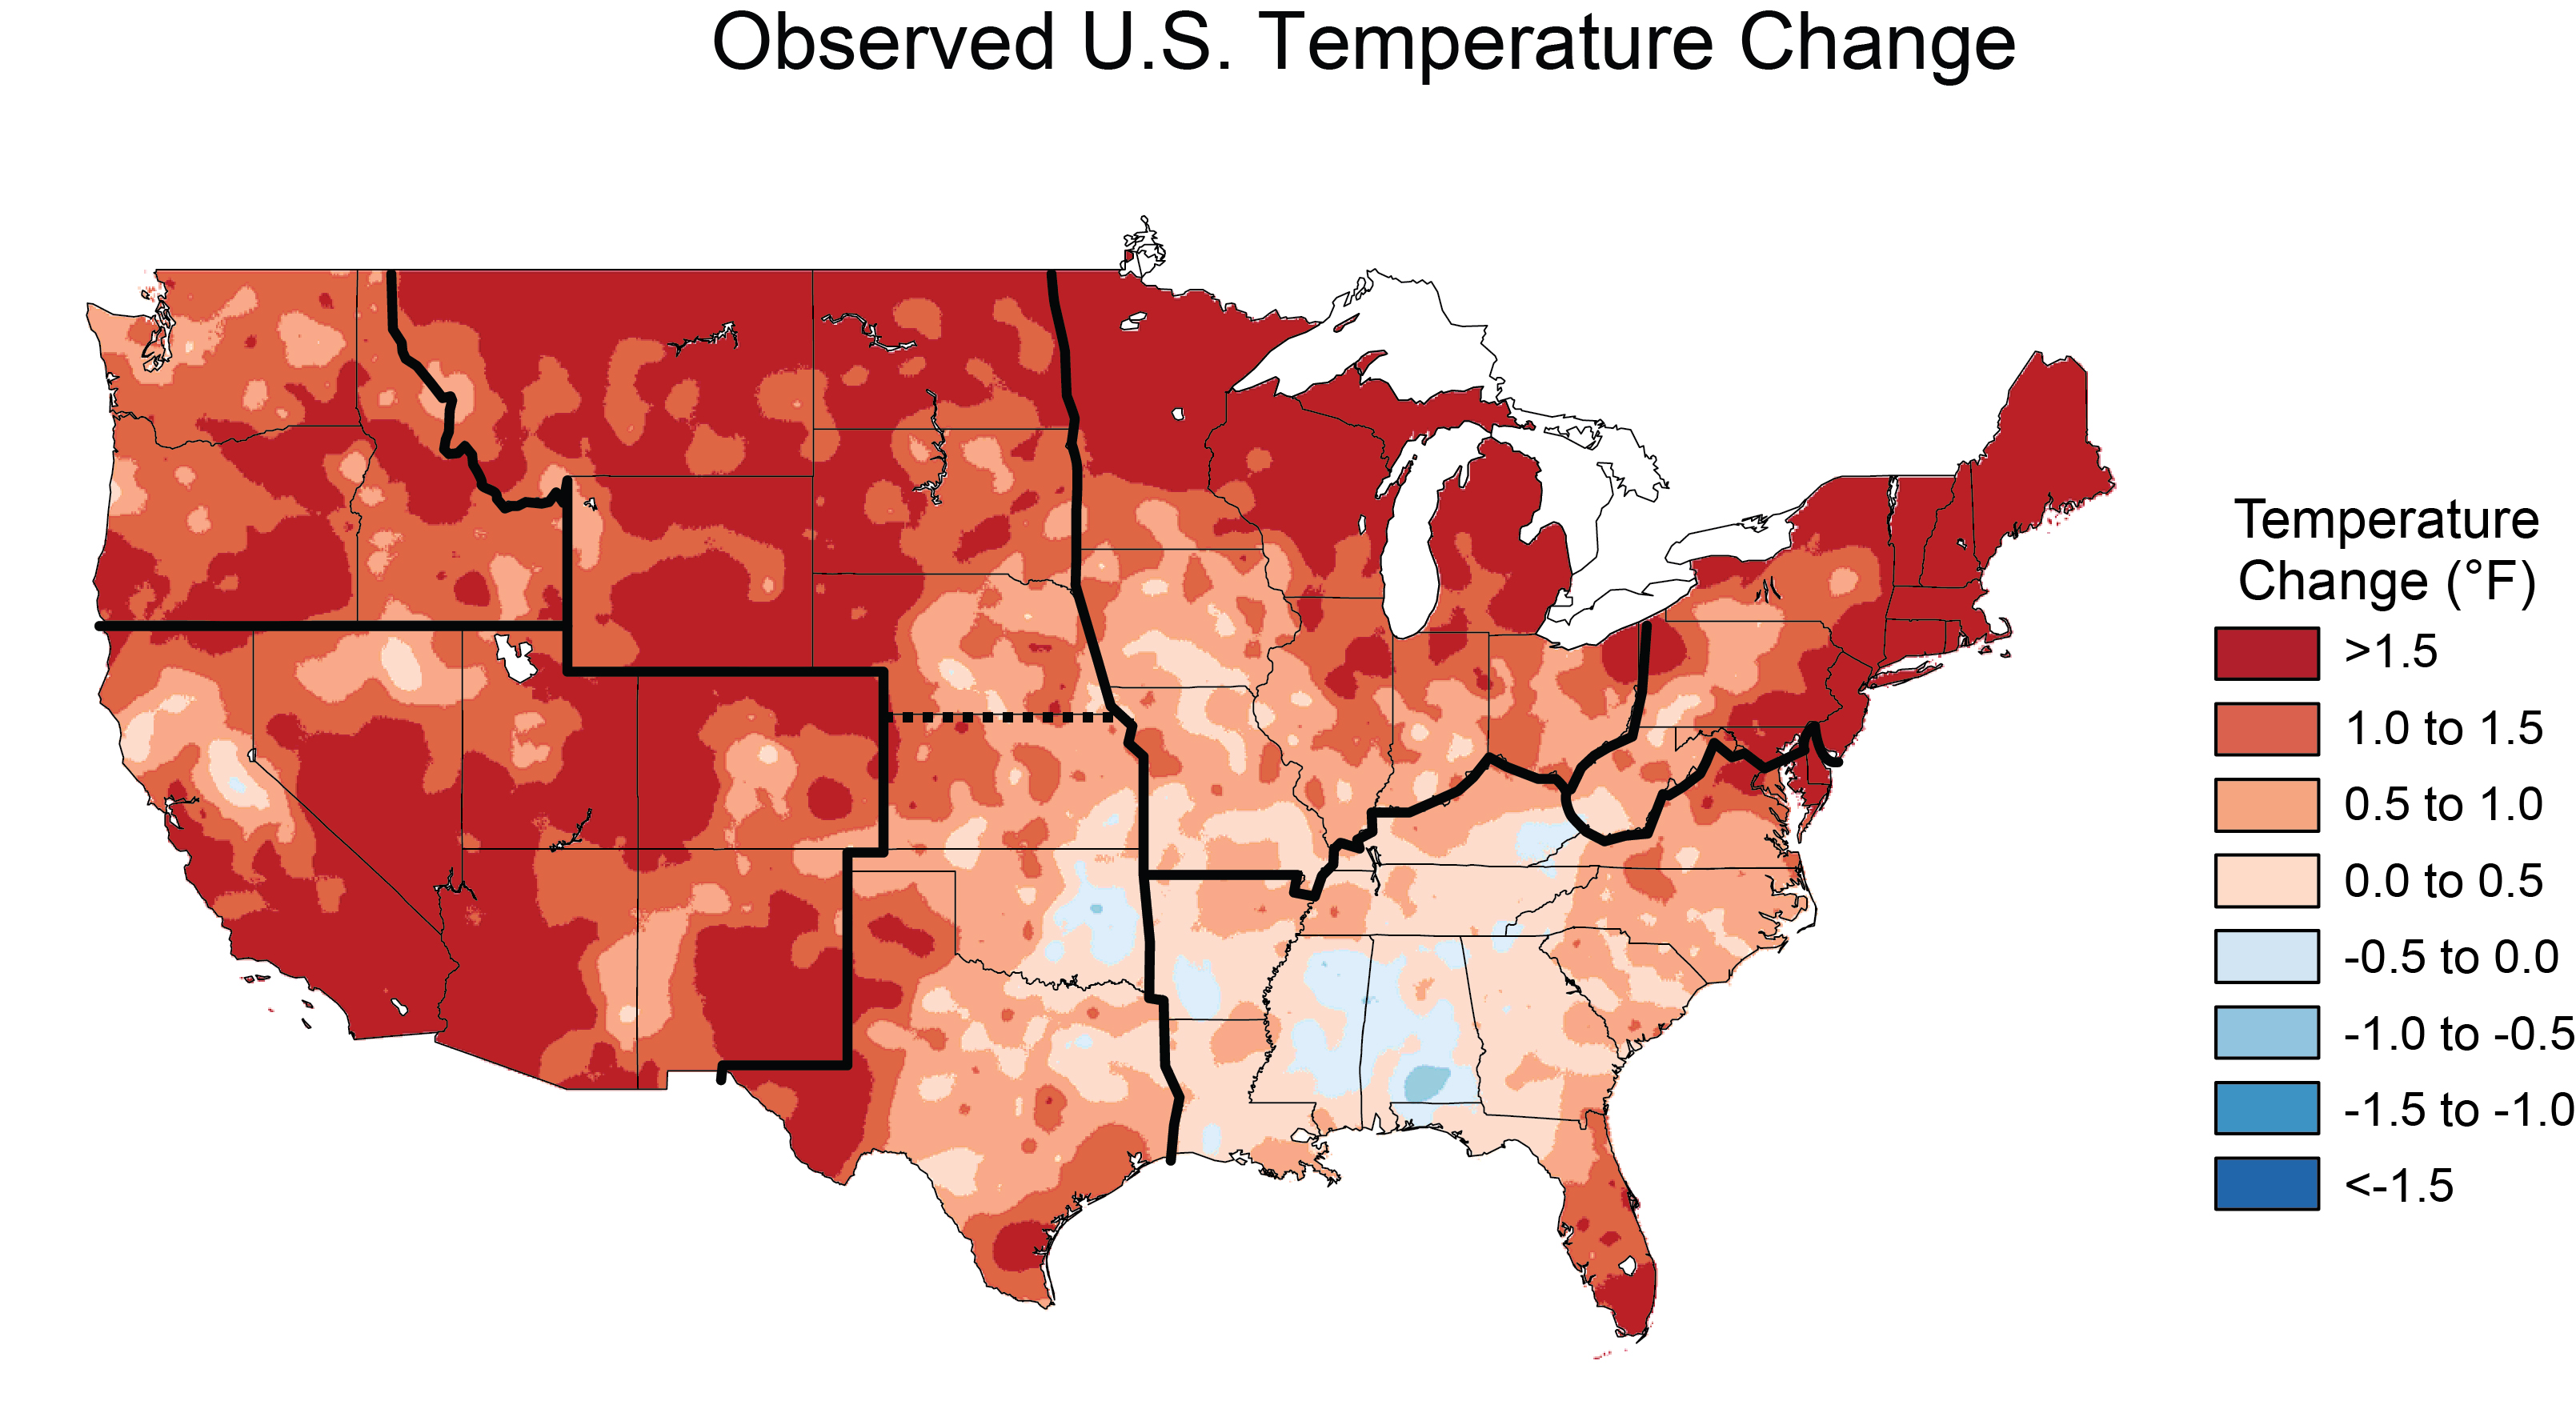
A new federal-data analysis has identified which U.S. states have warmed fastest since 1980, with Alaska, Utah, New Mexico, Colorado and Nevada showing the steepest increases in daily maximum temperatures, according to a study published in the Nature-family journal Scientific Data by researchers at the Massachusetts Institute of Technology. Hawaii, Montana, North Dakota, South Dakota and Arkansas showed the smallest average warming trends over the same period, the study found.
The research, led by scientists at the MIT Center for Sustainability Science and Strategy (CS3), does not report a single new weather event or disaster. Instead it compiles, for the first time at this level of detail, a state-by-state and month-by-month temperature record covering more than four decades, intended as a planning tool for governments and industry rather than a headline-grabbing finding on its own. It was published online and described in a press release from MIT News on October 30, and picked up independently by science-news outlets including Phys.org this week.
What the data show
The team built its dataset from two long-running atmospheric reanalyses: NASA's MERRA-2, produced by the agency's Global Modeling and Assimilation Office, and the European Centre for Medium-Range Weather Forecasts' ERA5 reanalysis, distributed through the Copernicus Climate Data Store. Both combine satellite, surface-station and model data into a continuous record stretching back decades, which the researchers used to calculate average maximum, minimum and mean daily temperatures for every state, broken down by month, from 1980 through 2022.
Rather than simply reporting degrees of warming over time, the researchers framed their results as "global warming-attributed" trends: the change in a state's temperature per degree of global average warming. By that measure, Alaska's monthly-averaged maximum daily temperature has risen by about 2.5 degrees Celsius for every degree of global warming, the fastest rate of any state. Hawaii's equivalent figure is about 0.8 degrees Celsius, the lowest. Utah, New Mexico, Colorado and Nevada rounded out the top five fastest-warming states, while Montana, North Dakota, South Dakota and Arkansas joined Hawaii at the bottom of the ranking. Nationally, the warming signal was strongest in late summer and fall, particularly September and November, the study found.
Current global average temperature stands at roughly 1.63 degrees Celsius above the 1850-1900 preindustrial baseline, according to monitoring from the Copernicus Climate Change Service, the figure the MIT team used as its reference point for calculating state-level sensitivity.
Why a state-level breakdown matters
National and global temperature averages are the most commonly cited measures of climate change, but they can obscure sharp regional differences that matter more to the people and infrastructure actually exposed to them. Earlier efforts to track U.S. warming, including the federal government's National Climate Assessment, have mapped temperature change geographically but not always in a format broken down consistently by state and by month across more than 40 years using two independent reanalysis datasets. The CS3 team argues that this combination gives planners a more granular, comparable basis for anticipating where heat-driven stress on crops, water supplies, the power grid and public health is likely to intensify fastest, rather than relying on national figures that average over very different regional experiences.
The mountain West and Alaska pattern identified in the study is broadly consistent with long-standing findings that high-latitude and high-altitude regions tend to warm faster than the global average, a phenomenon associated with feedback effects involving snow and ice cover, atmospheric moisture and elevation. Island and coastal states such as Hawaii, by contrast, are moderated by the surrounding ocean, which absorbs heat more slowly than land and helps buffer local temperature swings.
Who the findings are meant to inform
The dataset is aimed less at the general public than at state agencies, utilities, agricultural planners and infrastructure managers who need a consistent way to compare warming exposure across jurisdictions. For states near the top of the list, such as Utah, New Mexico, Colorado and Nevada, the trend has direct implications for water allocation, wildfire risk and electricity demand for cooling, all of which are sensitive to how quickly maximum daily temperatures climb. For Alaska, faster warming bears on permafrost stability, coastal erosion and infrastructure built on frozen ground.
C. Adam Schlosser, deputy director of MIT CS3 and a co-author of the study, said the results were meant to help target where adaptation spending would do the most good.
"Based on these results, we encourage decision-makers to assess states that have undergone the steepest increases in maximum and minimum daily temperatures, and identify where continued trends would indicate a rapid progression toward thresholds beyond which natural and managed resources, ecosystems, and infrastructure can function safely. In such cases, triaging and adaptive measures would take a high priority. By directing resources to where they are needed most, state and regional planners could significantly reduce climate-related physical and financial risks."
The paper's authors note that their approach differs from earlier U.S. temperature-trend reporting by aggregating maximum, minimum and mean daily readings at the state level for each calendar month, rather than producing a single annual figure per state. That format, they say, is intended to make the data more directly usable by planners who need to know, for instance, whether a state's warming is concentrated in summer heat extremes or in milder winters.
Caveats and what comes next
The study is observational and descriptive: it documents historical warming patterns rather than making new projections about future temperatures or attributing specific extreme-weather events to climate change in individual states. Because it relies on reanalysis products rather than raw station observations alone, the figures carry some model-dependent uncertainty, though MERRA-2 and ERA5 are both widely used and cross-validated against ground-based and satellite records in prior peer-reviewed work. The researchers also caution that local anomalies, such as unusual ocean or atmospheric patterns in a given year, could cause short-term departures from the broader trend even in fast- or slow-warming states.
The authors say they expect the state-by-state trends identified in the paper to persist as global average temperature continues to rise, absent unforeseen regional shifts, and they frame the open-access dataset itself, rather than any single finding, as the study's main contribution. Because the underlying data are published alongside the paper, other researchers, state climatologists and risk analysts can extend the analysis to finer geographic scales, examine individual months or seasons in more detail, or combine it with population and infrastructure data to model localized exposure. The MIT team's broader Global Change program has previously produced annual outlooks on climate risk, and the new dataset is likely to feed into similar assessments going forward as state and local agencies look for finer-grained evidence to justify where adaptation money gets spent first.