Satellites Reveal a Deeper Human Fingerprint on the World's Water
A reanalysis of two decades of gravity-satellite data finds that human activity, not climate alone, best explains long-term water-storage trends in 40 regions worldwide — and that groundwater losses in several heavily pumped areas run roughly a third worse than earlier estimates.
A sharper reading of two decades of satellite gravity data has turned up a clear human signature in how water is stored on land across most of the world, according to a study led by NASA hydrologists that identifies 40 regions where irrigation, reservoir filling and land clearing — rather than natural climate variability — best explain long-term gains or losses in water storage.
The analysis, published this week in the Proceedings of the National Academy of Sciences and summarized by NASA's Earth Observatory, reprocesses raw measurements from the twin GRACE and GRACE-FO satellites to produce a far more detailed picture of terrestrial water storage than earlier versions of the same data allowed. The satellites, which fly in tandem and track minute changes in the distance between them caused by shifting mass below, have been used for more than 20 years to monitor how much water — as groundwater, surface water, snow and ice — is gained or lost across the planet.
A finer-grained picture emerges
The new study, led by Mary Michael O'Neill of the University of Maryland in collaboration with NASA Goddard Space Flight Center scientists Matthew Rodell and Bryant Loomis, covers April 2002 through November 2025. Rather than relying on the standard monthly "mascon" processing used in most prior GRACE research, the team applied a stacked regression technique directly to the raw inter-satellite ranging data, according to the preprint posted to NASA's technical reports server. That approach yields five to ten times more spatial detail, at some cost to month-to-month precision, making it possible to attribute storage trends to specific human activities at scales relevant to water managers rather than only across broad river basins.
The finer resolution also produced larger estimates of loss in some of the world's most stressed aquifers. Regional trend magnitudes in the new analysis average roughly a third larger than those from the traditional monthly approach, suggesting that groundwater depletion in several heavily pumped regions is more severe than earlier satellite-based estimates indicated.
Where the signal is strongest
Human-linked storage trends showed up on every non-polar continent except Australia. In four separate regions, the researchers found that a variable describing human activity correlated more strongly with the storage trend than any climate variable did — a result that moves the analysis beyond simply noting that people live near drying aquifers and toward identifying activity as the primary driver.
Groundwater pumping for irrigation continues to draw down storage in California's Central Valley, the southern High Plains of the United States, the Mexican state of Chihuahua, and northern India. The decline in northern India is steeper than earlier estimates suggested, and the study attributes only about 15 percent of it to the retreat of Himalayan glaciers — leaving the remainder tied to groundwater extraction for agriculture, a finding consistent with earlier NASA-led work on the region's vanishing groundwater reserves.
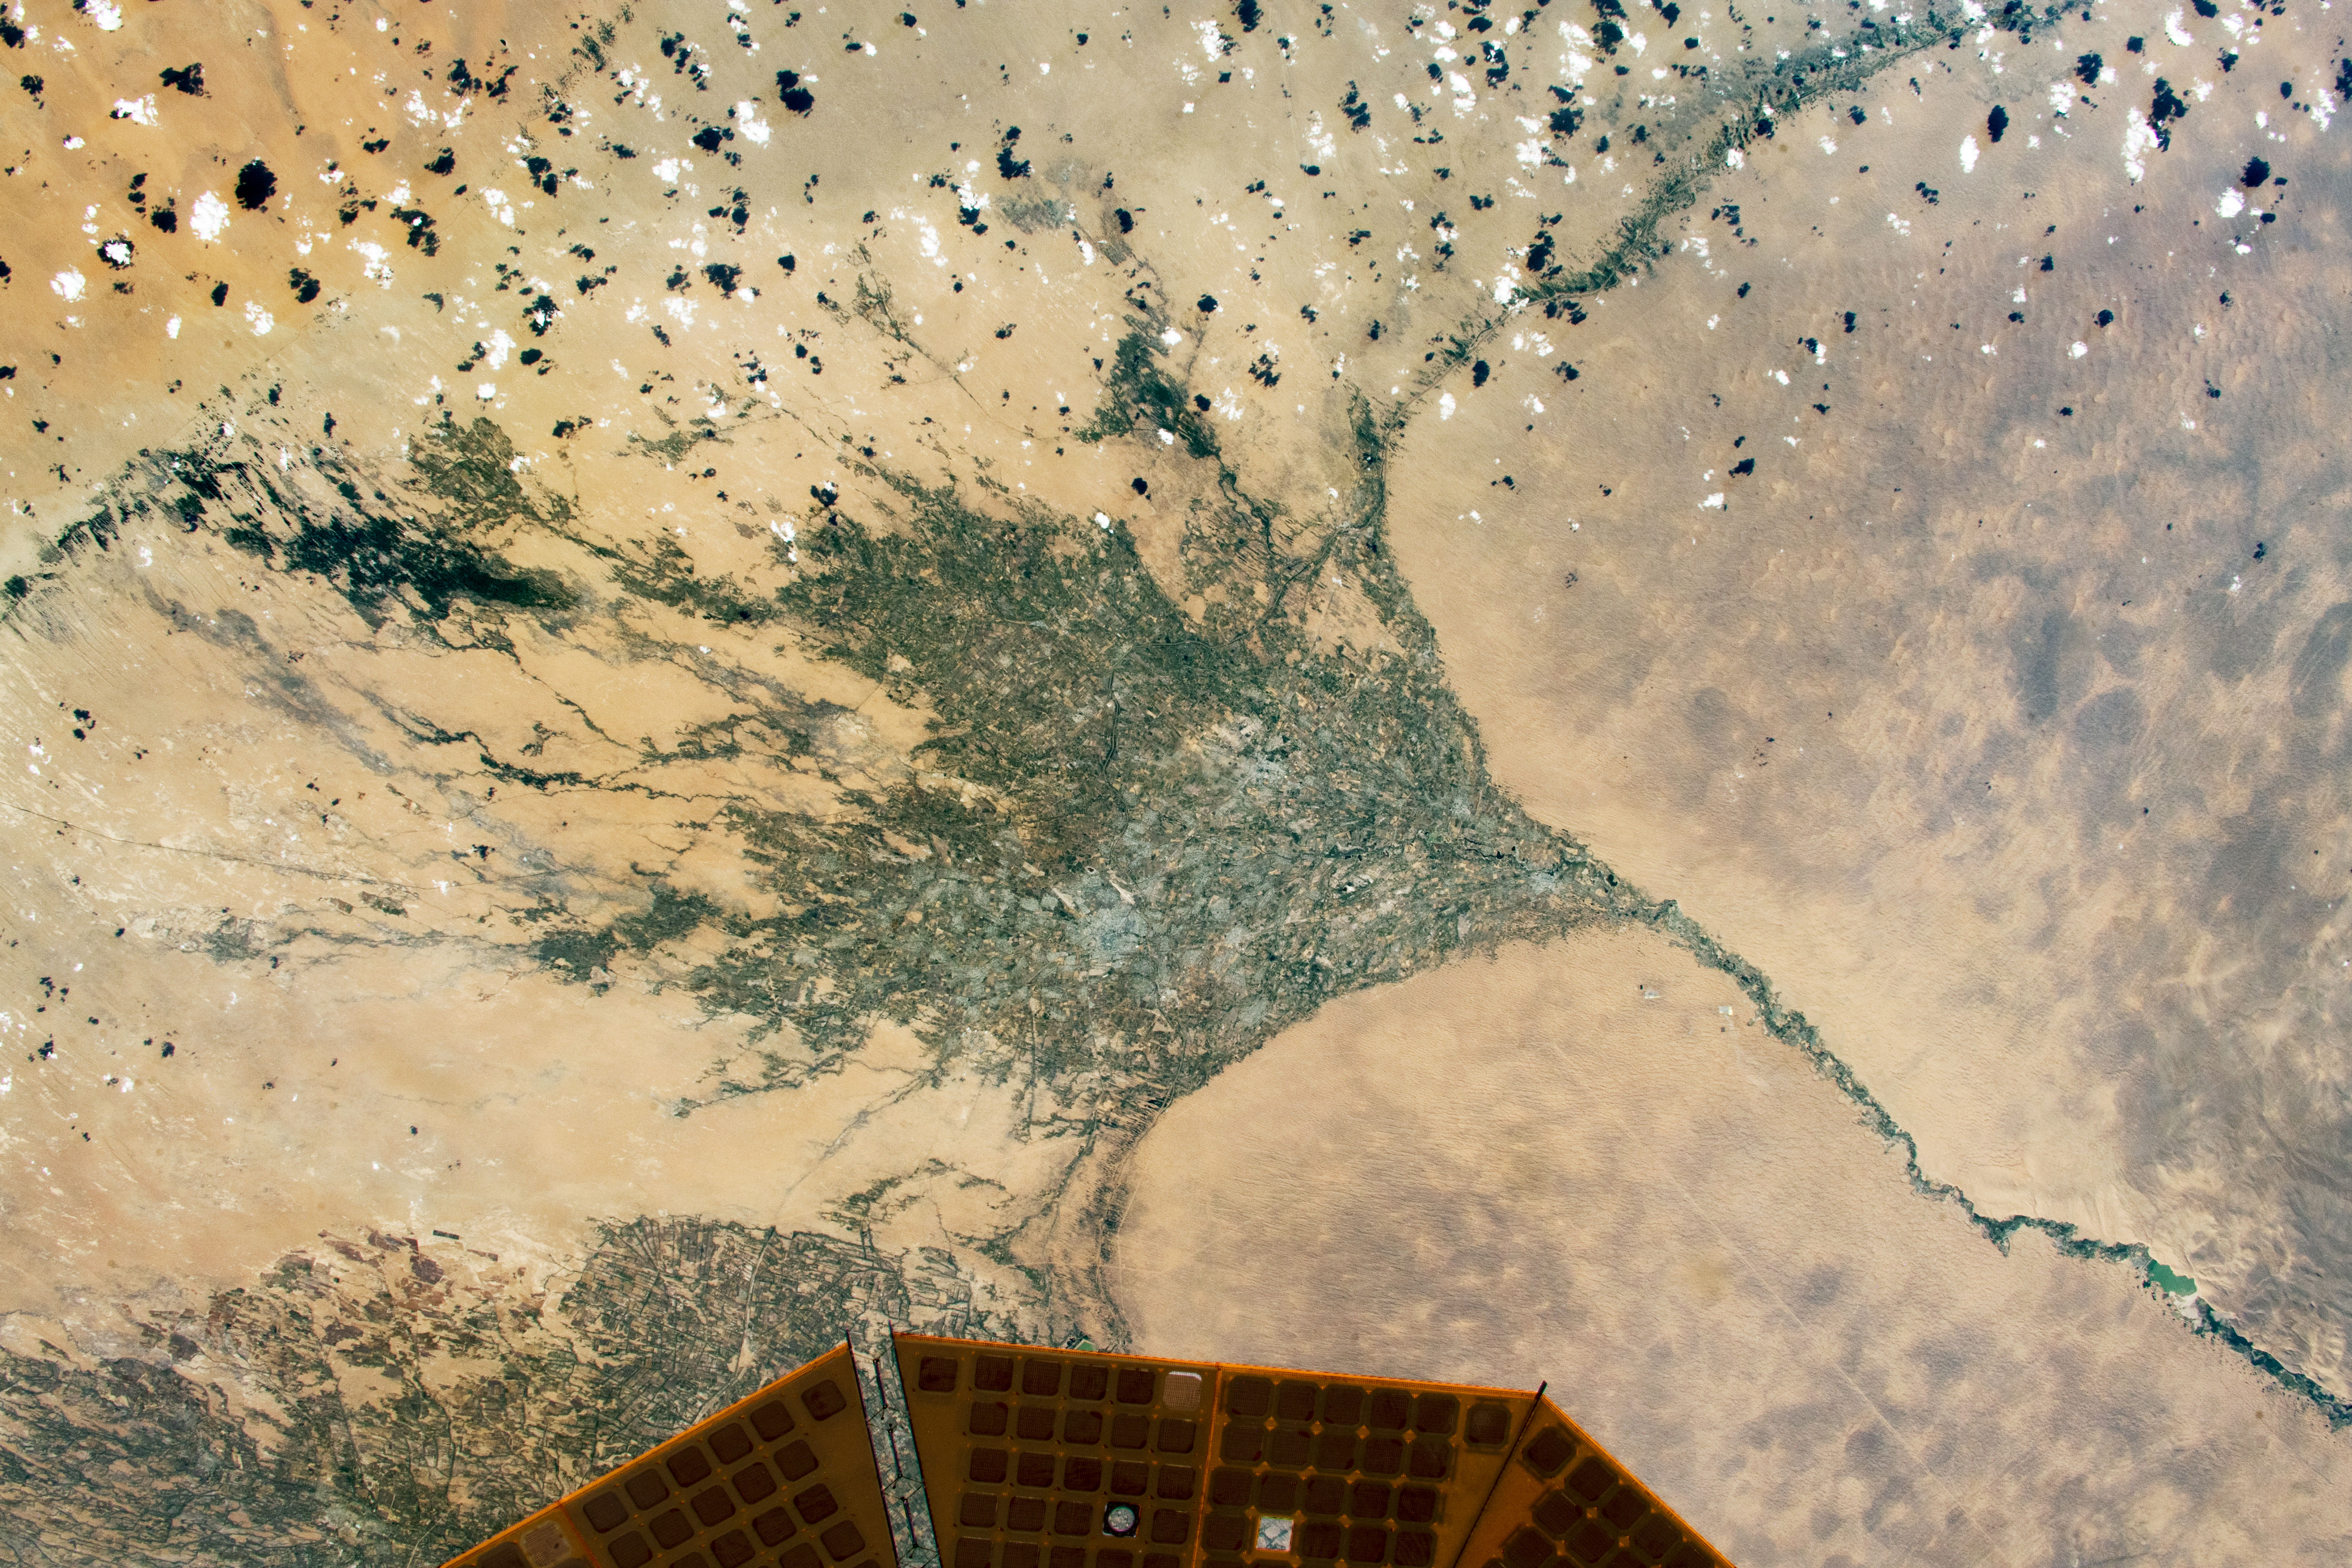
Not every human fingerprint pointed toward loss. In parts of sub-Saharan Africa, the expansion of rainfed millet farming onto former savanna coincided with rising water tables even in years of below-average rainfall. A similar pattern turned up in Brazil's Maranhão state, where soybean fields have replaced forest and shrubland and storage increased rather than fell — a pattern the authors suggest may reflect efficient water use by the crops themselves or longstanding land-management practices that direct rainfall into shallow aquifers. Large engineering projects left their own marks: the Boguchany Reservoir on Russia's Angara River, one of the largest reservoirs filled anywhere this century, produced the strongest storage trend detected in nonpolar northern Asia, while seepage from Turkmenistan's largely unlined Karakum Canal has measurably raised water storage in the surrounding desert.
"An anthropogenic variable showed a stronger relationship with the storage trends than any climate variable did," said Mary Michael O'Neill, the study's lead author and a hydrologist now at the University of Maryland.
Who the findings reach
The results bear most directly on water managers and farmers in the regions identified, particularly in parts of the United States, Mexico and India where groundwater pumping already outpaces natural recharge. Policymakers weighing irrigation limits, reservoir operations or groundwater regulation now have a finer-scale map of where human activity, rather than drought alone, is driving long-term losses — a distinction that matters for crafting remedies, since a drought-driven decline may reverse with wetter years while a pumping-driven one generally will not.
The work builds on a 2018 NASA-led study, published in Nature by Rodell and colleagues, that first used GRACE data to map 34 global "hot spots" of freshwater change and concluded that wet regions were generally getting wetter and dry regions drier. The new PNAS paper sharpens that earlier picture considerably, trading some of GRACE's monthly timing resolution for a view detailed enough to separate, for instance, a single reservoir's effect from the pumping happening in farmland many miles away.
What comes next
O'Neill said she next wants to examine how dams and water diversions affect storage downstream, separating the influence of nearby human activity from effects that travel far from their source. She also said she hopes to recover more of the month-to-month detail traded away by the new method, noting that the current analysis sacrifices some temporal resolution for its spatial gains.
The authors frame the approach as a template for future satellite gravity missions, which could be designed from the outset to balance spatial and temporal detail differently than GRACE and GRACE-FO did. With GRACE-FO now well past its original design lifetime, the technique also offers a way to extract more value from archived data as scientists and engineers debate what instruments should succeed it.

Antarctica's 'Doomsday Glacier' could add double the forecast sea-level rise, new model finds
Century of Records Shows Europe's Wild Bees Losing Ground

Japan Launches Spacecraft to Bring Home a Piece of a Martian Moon