Ice sheets have shed 11.3 trillion tonnes since 1979, most complete satellite record yet shows
A half-century satellite reconstruction of Greenland and Antarctica finds glaciers accelerating into the ocean are driving most of the loss, adding more than three centimetres to global sea levels and putting millions more people at risk of coastal flooding.
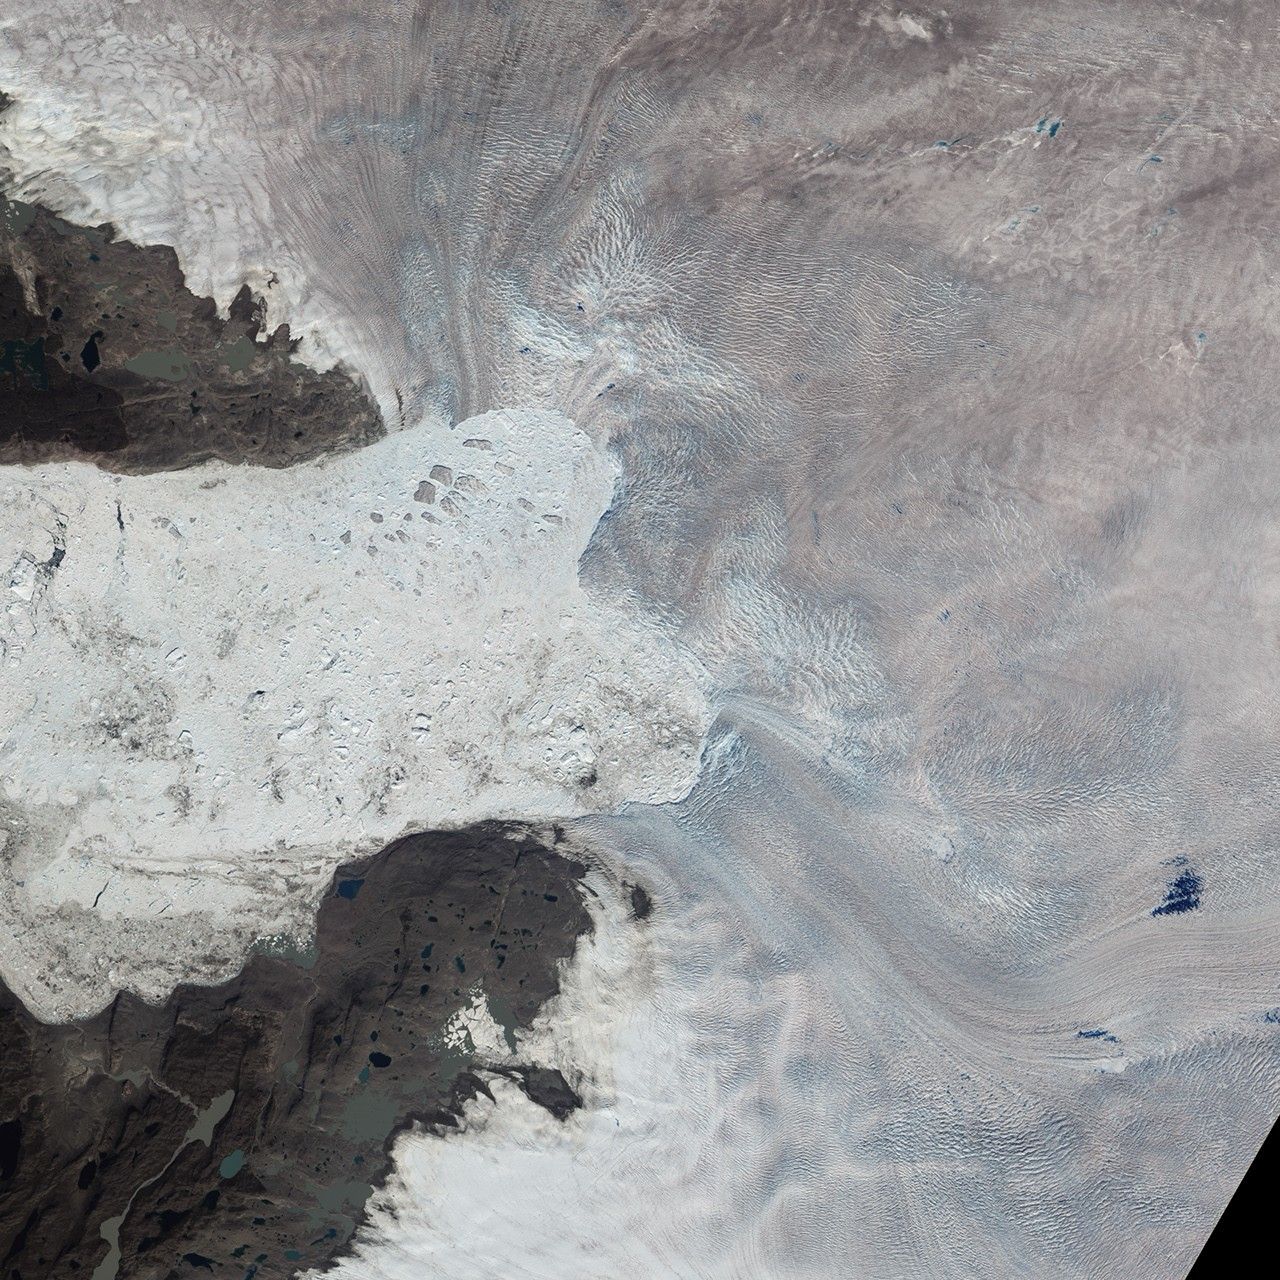
Greenland and Antarctica have together lost 11.3 trillion tonnes of ice since 1979, according to the longest continuous satellite record of the two ice sheets ever assembled. The assessment, published this week in the journal Scientific Data, combines 42 independent surveys drawn from 27 satellite missions to trace changes in ice sheet mass back to the early 1970s, and finds that the pace of loss has been driven overwhelmingly by glaciers flowing faster into the ocean rather than by ice melting where it sits.
The study was led by Dr Inès Otosaka and Professor Andrew Shepherd of Northumbria University in England, working with Dr Tyler Sutterley of the University of Washington's Applied Physics Laboratory, under the banner of the Ice Sheet Mass Balance Inter-comparison Exercise, a satellite research consortium backed by the European Space Agency and NASA. It is the group's third major reconciliation of competing satellite measurements since 2012, and the first to stretch the record back to 1972 for Greenland and 1979 for Antarctica.
The numbers
Between 1979 and 2023, the two ice sheets lost a combined 11,309 billion tonnes of ice, plus or minus 565 billion tonnes, the paper states. That loss added roughly 31.4 millimetres, or about 3.1 centimetres, to global mean sea level over the period — Greenland contributed about 18.1 millimetres and Antarctica about 13.3 millimetres. Ice sheets now account for close to a quarter of all observed global sea level rise, up from a far smaller share when satellite monitoring began.
The rate of loss has climbed steeply. Greenland shed roughly 60 billion tonnes of ice a year in the 1980s; by the 2010s that figure had risen to about 264 billion tonnes annually. Antarctica's annual loss rose from around 48 billion tonnes to roughly 202 billion tonnes over the same span. Crucially, the researchers found that 84 percent of the combined loss came from glaciers accelerating and discharging more ice into the ocean, with only 16 percent attributable to surface melting from warmer air. Outlet glaciers such as Jakobshavn, on Greenland's west coast, illustrate the pattern: the glacier's calving front has retreated markedly over the past two decades as it has sped up.
The record also shows a brief pause: between 2020 and 2023, losses slowed, a shift the team attributes to a run of unusually heavy snowfall in East Antarctica and milder summers in Greenland. Researchers describe this as short-term variability rather than a break in the underlying trend.
A record built to explain a warming ocean
IMBIE was set up in 2011 to resolve disagreements among competing satellite techniques — radar and laser altimetry, gravimetry from missions such as GRACE, and input-output mass budget methods — that had previously produced widely differing estimates of how fast the ice sheets were changing. Its first two major reconciliations, covering Antarctica from 1992 to 2017 and Greenland from 1992 to 2018, were published in Nature and became reference points for the Intergovernmental Panel on Climate Change's sea level projections.
The new assessment extends that record by roughly two decades at the front end, using early data from the Landsat archive and other historical sources to reconstruct ice sheet behaviour before dedicated satellite gravity and altimetry missions existed. That longer baseline, the authors argue, is what allows them to attribute the acceleration in ice loss so clearly to the ocean rather than the atmosphere: glaciers that terminate in the sea have spent decades responding to water that is gradually warming from below, eating away at ice shelves and grounding lines that would otherwise hold glaciers back.
The new totals sit comfortably alongside, and extend, the group's earlier findings. The 2018 IMBIE assessment put Antarctic losses at roughly 2,720 billion tonnes between 1992 and 2017, while the 2020 Greenland assessment found about 3,902 billion tonnes lost between 1992 and 2018. Because the new study reaches back to the 1970s and forward to 2023, it captures both the relatively stable decades before large-scale loss began and the sharp acceleration that has followed, giving climate scientists a fuller baseline against which to judge whether current trends are holding, easing or worsening.
Otosaka said in a statement issued alongside the paper by Northumbria University that reaching back to the 1970s makes it possible to see how the ice sheets have changed across half a century, and that the dominance of ocean-driven glacier acceleration over surface melting points to warming seawater, not simply warmer air, as the principal driver of the long-term trend.
"Three centimetres of sea level rise may sound small, but that puts another six to nine million people at risk of coastal flooding and erosion. With the ice sheets set to lose much more ice in the decades ahead, global assessments like IMBIE are vital to protecting communities impacted by climate change," said Andrew Shepherd of Northumbria University.
Who is affected
The people most exposed to the trend documented in the study are not in the polar regions themselves but along low-lying coastlines worldwide. Otosaka has said that each roughly one-centimetre increment of global sea level rise exposes an additional two to three million people to annual coastal flooding, a relationship that scales directly with the ice loss totals in the new record. Low-elevation river deltas in South and Southeast Asia, small island states in the Pacific and Caribbean, and cities such as Miami, Jakarta and New Orleans are among the places most frequently cited by coastal-risk researchers as vulnerable to incremental sea level rise compounded by storm surge.
The finding also matters for climate modellers and insurers who rely on ice sheet projections to estimate future flood risk and set long-term planning assumptions. Because the study shows glacier dynamics, not surface melt, driving most of the loss, it strengthens the case that ice sheet contributions to sea level rise are tied to ocean temperature trends that are expected to persist and intensify even if atmospheric warming were to slow.
Reaction
Independent scientists broadly welcomed the extended record. Eric Rignot, a glaciologist at the University of California, Irvine who was not involved in the study, told reporters in comments carried by the Associated Press wire report on the findings that "the ice sheets are melting away fast," adding that the trend would "exacerbate the vulnerability of coastal regions" as it continues. Otosaka said the data show a clear, decade-on-decade increase in mass loss, particularly in the ice being discharged directly into the ocean, while Shepherd noted that ice sheet changes are "tracking decades behind global warming," meaning further losses are effectively already locked in regardless of near-term emissions choices.
Dr Diego Fernández of the European Space Agency, which co-funds the IMBIE consortium alongside NASA, said the results underscore the value of sustaining the satellite missions that made the reconstruction possible. Sutterley, the IMBIE co-lead at the University of Washington's Polar Science Center, said the expanded pool of participating research teams and improved handling of measurement uncertainty make the new figures "the most robust assessment of ice sheet mass balance produced so far."
What happens next
The IMBIE team says it intends the extended record to feed directly into the next round of international climate assessments, including future IPCC sea level projections, which rely on reconciled satellite estimates rather than any single measurement technique. Researchers involved in the project have also pointed to the importance of maintaining continuity of the satellite missions supplying the underlying data, including ESA's CryoSat-2 radar altimeter and the Sentinel satellite series, both of which are approaching the age at which agencies typically plan replacement missions.
Scientists caution that the 2020-2023 slowdown should not be read as a sign that ice sheet losses are easing. With ocean temperatures continuing to rise and glacier dynamics responding on a lag of years to decades, the study's authors expect the long-term acceleration documented over the past half century to resume, with consequences for coastal populations that will unfold gradually over the coming decades rather than arrive as a single, dramatic event.

New Horizons Data Reveals First Evidence of Flowing Liquid on Pluto

Genetic study splits South America's tiger cats into five species, naming one entirely new
